[Tech Bites] Time-series 101 – defining time-series data

Immersive financial interface and statistics over blurry dark background. Concept of analytics and data science. 3d rendering toned image double exposure

Data from manufacturing processes can be largely categorized as image data and time-series data.

Due to their inherent visibility, image data can be analyzed for physical defects based on visual inspection or machine vision.


In contrast, time-series data often seem to appear as repeated patterns, but are difficult to unique define.

Because time-series are collected from multiple sensors and sources, understanding the complex relationships among these high-dimensional data goes beyond human intelligence.


We, as three-dimensional beings, can comprehend at most 3D information on the xyz plane. But artificial intelligence (AI) can be extended to the fourth-dimensional (4D) space represented by a xyzw plane and further.

A industries increasingly implement intelligent systems, sensors, and tools to work smarter and more efficiently, the potential of AI for time-series analysis will be proposed as an alternative to overcome the limitations of human comprehension.

Image data v. Time-series data

An image captures the results from a particular moment in time. Therefore image data are commonly used to detect a certain event or occurrence of a faulty product at a specified period or state.


For example, image data are used by machine vision equipment to detect faulty products in manufacturing. Although such vision inspections can determine whether a product is faulty or not, we cannot identify when the defect occurred, what the cause is, and how we can improve our process to prevent such occurrences.


Contrarily, time-series data contains the entire history of a product. Therefore, when we evaluate time-series data, we can determine at what point and for what reason a defect occurred, and ultimately plan for process improvement.

What exactly is time-series data?

Time-series data are a collection of sequential data changing over time.

It is widely used across many industries and applications: robo-advisors and stock price predictions in the financial sector, and biometric measurements such as heart-rate, sleep patterns, and stress indices in the healthcare industry.

Types and Characteristics of Time-Series Data

Time-series data appear in forms and types that are as diverse as their applications.

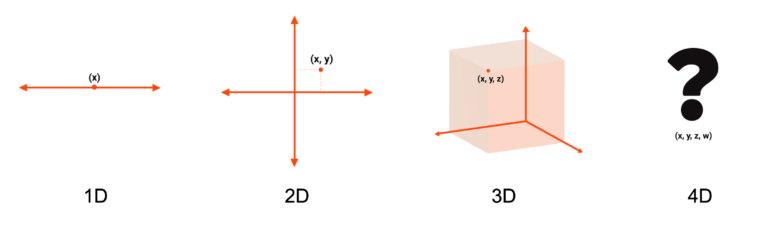
Most common way of categorizing time-series data is by the number of feature variables: (1) univariate time-series, (2) multivariate time-series.

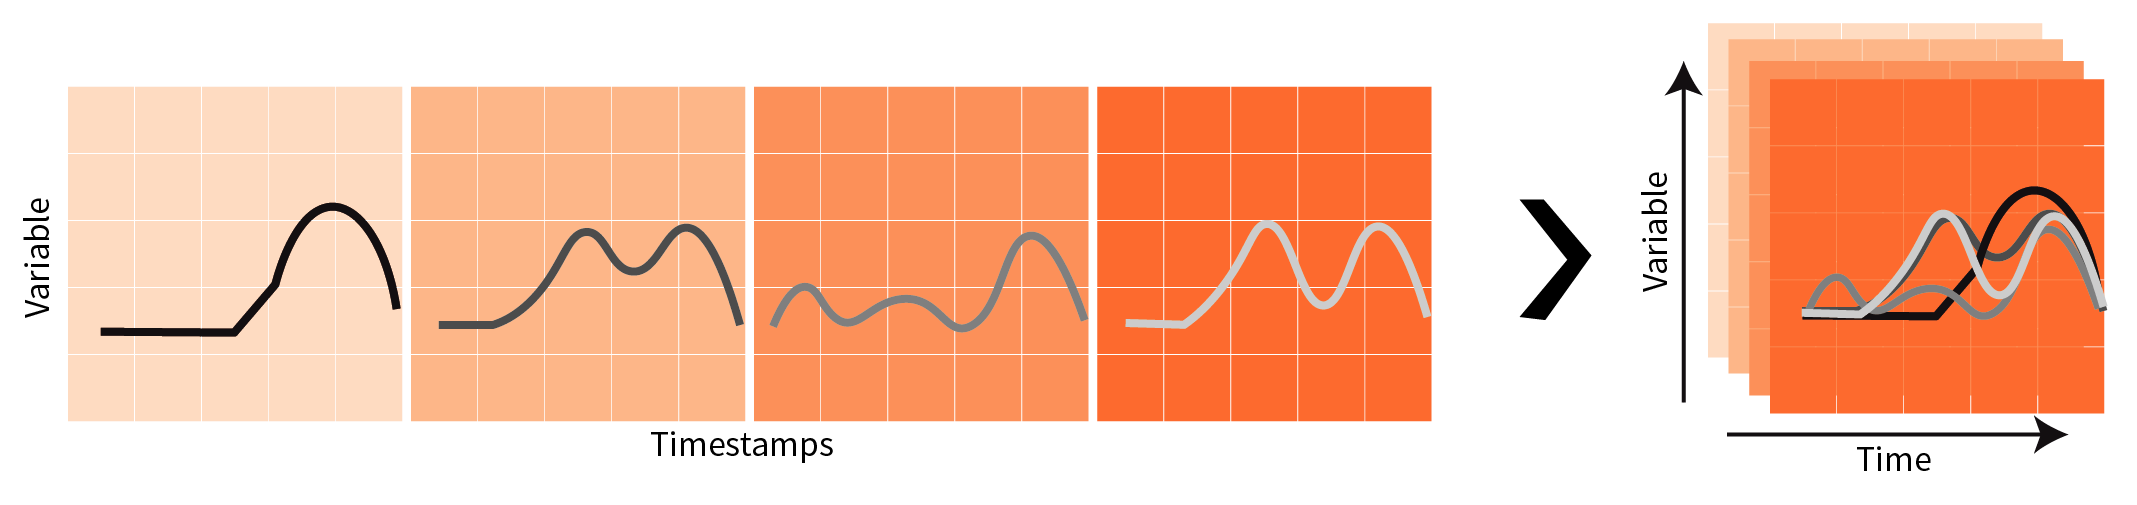
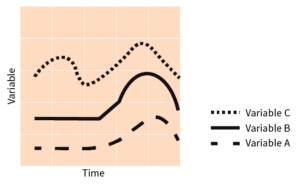
Univariate time-series capture the trend of one variable over time; whereas multivariate time-series can provide insight into the relationships amongst different variables.

Depending on the consistency of sampling rate, time-series data can be categorized into metrics and events.

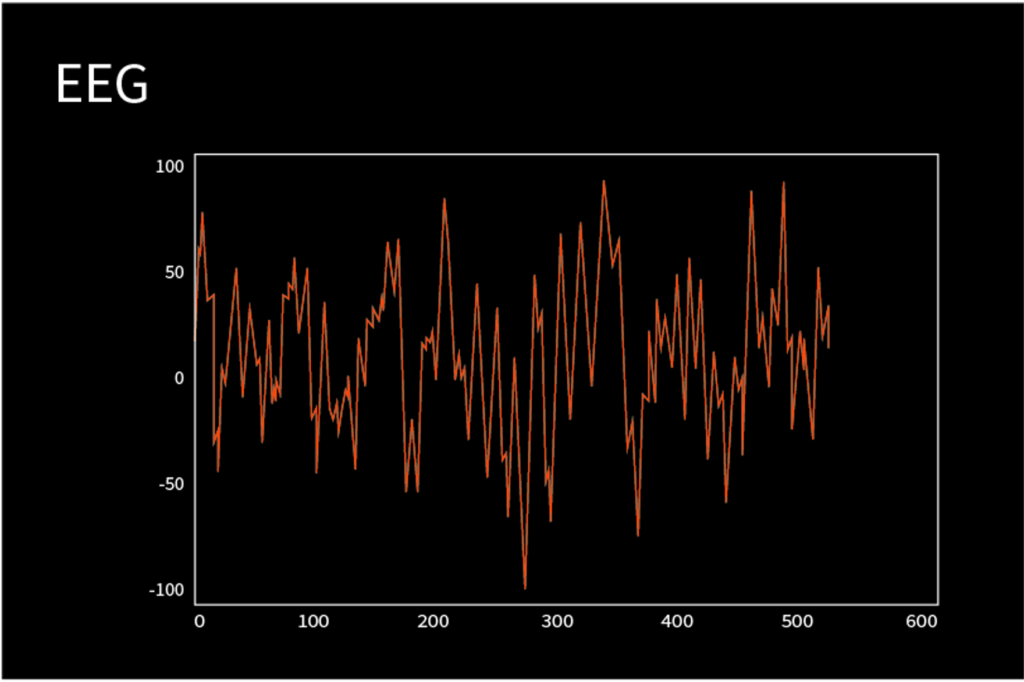
Biometric data such as heartrate, financial performance data, or sensor data from manufacturing equipment collected over a fixed time period are all examples of metrics.


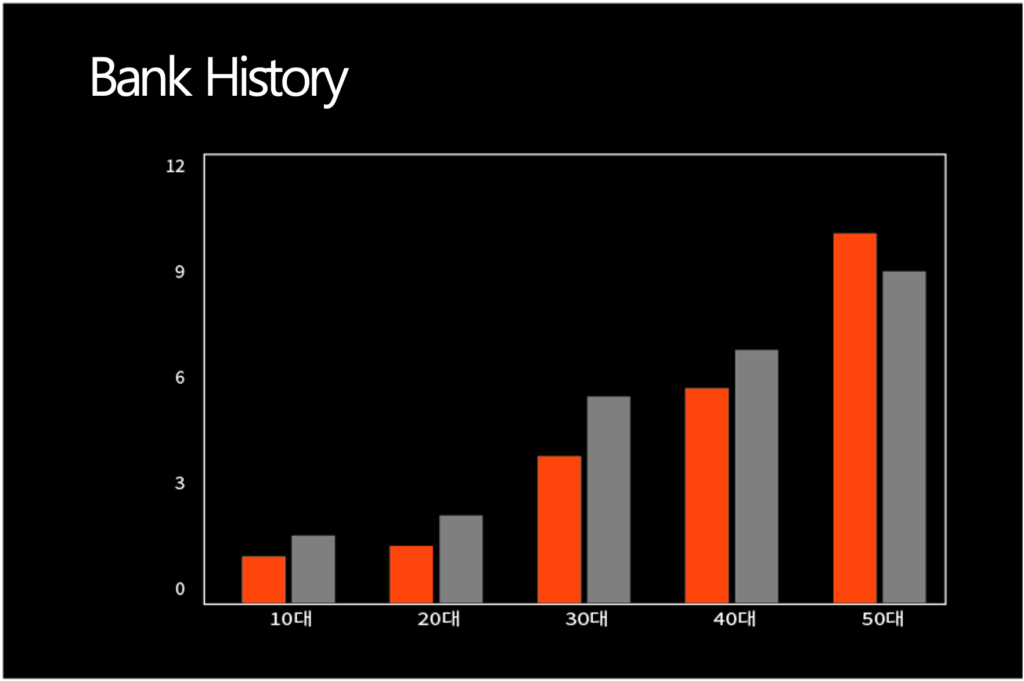
Bank deposit and withdrawal history and the number of daily tweets in the US are examples of event data – data in which there is no time correlation between events.

Regularly samples metric data can be further described as discrete or continuous.

Discrete time-series data are metric data collected on a finite sampling interval; on the other hand, continuous data have infinitely small sampling intervals.

Since computers digitize data, they cannot store continuous time-series. Theerefore, when it comes to computer-based time series analysis, continuous time series data are not relevant concepts.

So, how does RTM categorize its data?

We take different approaches to collect, process, and analyze data depending on their characteristics. Based on our experience and expertise of manufacturing data analysis, we first determine whether the data pertains to a repetitive or continuous process.

For example, semiconductor manufacturing consists of repeatedly removing (or etching) and creating (or depositing) substrate layers on a silicon wafer. If we understand this basic principle, we can also not only identify the process step, but also the wafer and lot information by extracting time indices.

Through structural and statistical analyses of single-pattern units, we can distinguish normal samples from anomalies.

Data from continuous processes can often be used to predict equipment lifespan (i.e. RUL or Remaining Useful Life).

For example, the average equipment lifetime of a power plant turbine motor is approximately two years – assuming continuous operation. Therefore, sensor data can be continuously collected for two years, while at the same time alerting engineers of necessary equipment maintenance and repair cases prior to the regular maintenance schedules.

Research Lab

10F Kwangsung Bldg, 11, Yeoksam-ro 3-gil, Gangnam-gu, Seoul, Republic of Korea

Headquarter

7F Kwangsung Bldg, 11, Yeoksam-ro 3-gil, Gangnam-gu, Seoul, Republic of Korea

Email

admin@rtm.ai

Tel

02.2088.6780

Fax

070.7543.6780

© 2022 RTM. All Rights Reserved.

Research Lab          Youtube        Facebook

Research Lab

10F Kwangsung Bldg, 11, Yeoksam-ro 3-gil, Gangnam-gu, Seoul, Republic of Korea

Headquarter

7F Kwangsung Bldg, 11, Yeoksam-ro 3-gil, Gangnam-gu, Seoul, Republic of Korea

Email

Tel

Fax

admin@rtm.ai

02.2088.6780

070.7543.6780

© 2022 RTM. All Rights Reserved.
Scroll to Top